
When you are new to crypto, it can be quite overwhelming to come across so many options when investing in crypto. It feels like there are new tokens coming to the scene every day as many dedicated individuals and companies are on a mission to using the blockchain in order to create their own cryptocurrency projects. To date, there are over 11,000 different cryptocurrencies which makes it impossible to understand what every project does and why they may or may not be bring value to society and its investors. If you are unaware of where to get started when trying to understand the cryptocurrency market, then me introduce you to CoinMarketCap.
CoinMarketCap provides a great detailed overview of a large number of the cryptocurrency projects out there. I would argue that it is the best site of this nature and I would consider CoinGecko as it’s main competitor. Overall, bost sites can be one of your best resources when trying to gain an understanding of what is happening at present in the cryptocurrency market.
The Home Page
Once on CoinMarketCap, you should be presented with a home page that looks something like the following image. It may look different depending on when you look at it since CoinMarketCap will likely make updates to the appearance of its website.
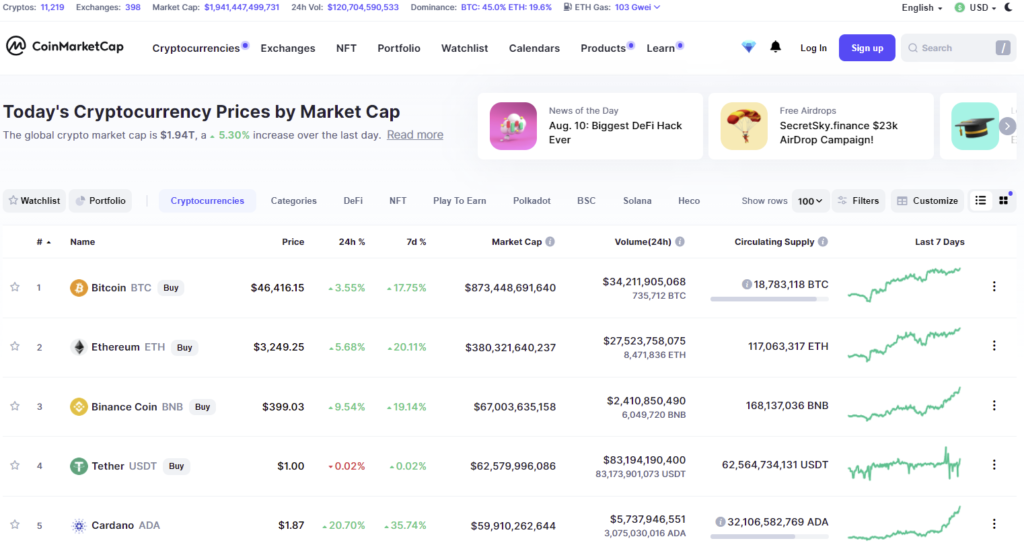
If you have never been to this website before, it is understandable that you will be overwhelmed by all of the information that is presented to you at once. Oftentimes, you will see a gray circle with a white “i” symbol that can give you more information about the information provided.
Cryptos
Starting at the top bar at the top left of the page. This shows you how many cryptocurrencies are currently listed on coinmarketcap.com. This number does not represent all of the cryptocurrencies in existence. However, it can give you an idea of the number of cryptocurrencies that have gained some type of recognition at minimum. When clicking on the crypto number link, it does not give you any additional information as it will just takes you to the home page with all of the listed cryptocurrencies.
Exchanges
Just like there are foreign exchanges, there are also cryptocurrency exchanges. Cryptocurrency exchanges are marketplaces where one is able to trade fiat currencies (like the United States Dollar or the Euro) or cryptocurrencies (like bitcoin or ether) for other cryptocurrencies or fiat currency. Exchanges are popular because they make it easier for cryptocurrency holders to invest in the coins that they desire. For example, if I wanted to obtain bitcoin (BTC), I would most likely need to go to access a cryptocurrency exchange to make this happen. The alternative would be to create a BTC wallet address, trade someone fiat money of some sort for bitcoin, and then have that same someone transfer the expected bitcoin to you.
Market Cap
This portrays the entire market capitalization of all cryptocurrencies listed on CoinMarketCap. In other words, this sections shows the entire amount of money invested into the cryptocurrency market. If $2 trillion dollars is shown here, for example, that means that holders of cryptocurrency have invested $2 trillion total into the coins listed on CoinMarketCap.
24h Vol:
This is the amount of money that has traded hands in the entire cryptocurrency market within the last 24 hours. This will be shown in your respective fiat currency (USD in my case) as well as the cryptocurrency examined. This number can be used to get an idea of how much activity there is in the cryptocurrency market at any given moment (the cryptocurrency market never closes).
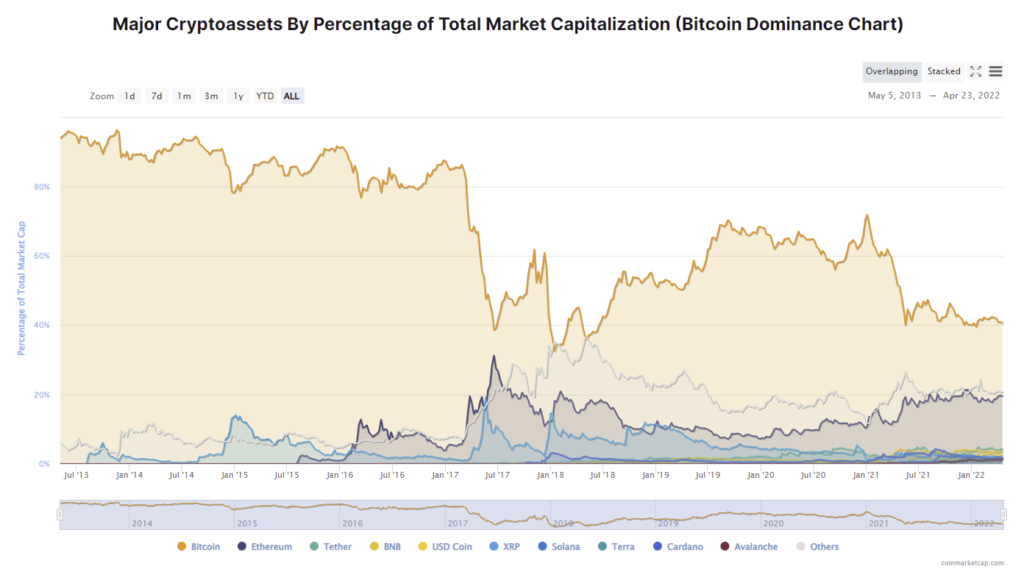
Dominance
Historically, BTC has dominated the other cryptocurrencies in terms of the amount of money invested. The proportion of money invested into BTC has always been higher than the rest of the cryptocurrency market and often more than the entire rest of the market combined. Simply by looking at the historical charts, if BTC is rising then the majority of altcoins (alternative cryptocurrencies AKA every cryptocurrency that isn’t bitcoin) tend to follow. The same is true if BTC is falling. If BTC is falling in price, then the majority of altcoins tend to decrease in value as well. The Dominance indicator used to only show BTC dominance but it shows Ether since the ETH token has gained in market dominance.
ETH Gas
Almost all cryptocurrencies have some sort of transaction fee and ETH Gas shows the average transaction fees for a regular transfer of funds from one ETH wallet to another. These transaction fees for ETH are called Gas and this is Gas price is denominated in GWEI. This is the amount that is needed to complete a transaction or execute a contract on the Ethereum platform. 1 ETH = 1,000,000,000 GWEI and 1 GWEI = 0.000000001 ETH
#
This is the first column of the page and it lists the rank of every listed cryptocurrency. Cryptocurrency are ranked by market cap. The higher the market cap, the higher a coin is ranked. See the market cap section below for more information about market cap.
Name
This is the actual name of the cryptocurrency coin or token which is probably self explanatory for most reading this. You can click on the name of the cryptocurrency to gain even more detailed information about the cryptocurrency.
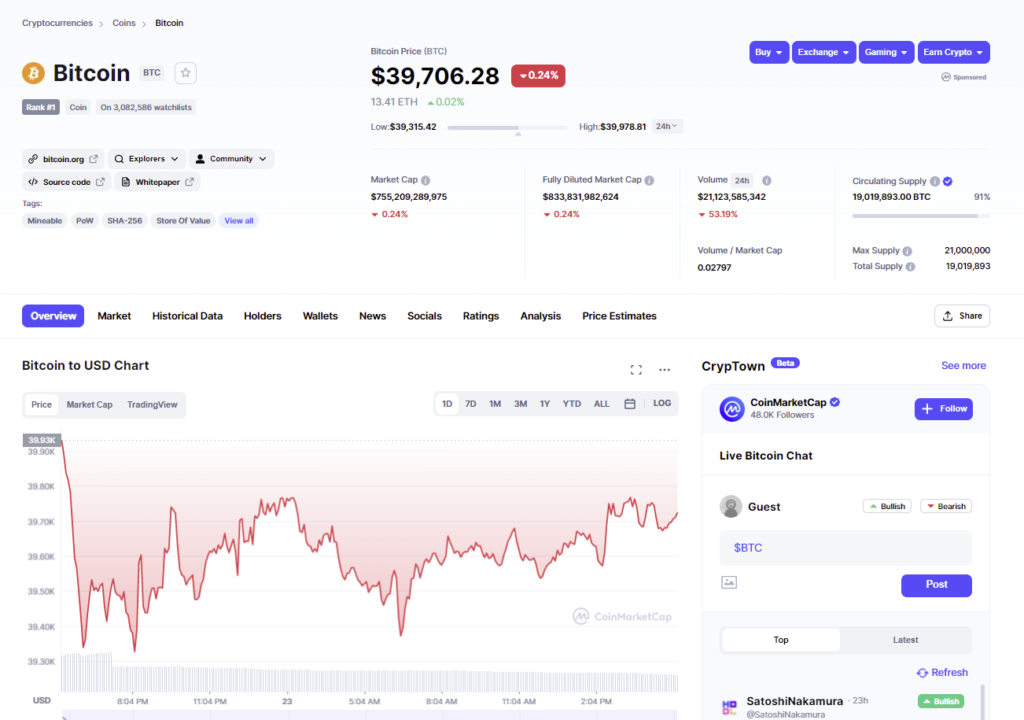
Price
This is what it will cost to gain 1 unit of the cryptocurrency in question. You will usually see this in your respective fiat currency (USD, EUR, etc.) but you can also view this from the perspective of other cryptocurrencies. For example, at the time of writing, it would cost you 0.06994 BTC to obtain 1 ETH.
24h %
This refers to the price action of the coin. It basically portrays whether or not the coin has gained or lost value within the last 24 hours.
7d %
Just like the 24h %, this is change in value of the coin within the last 7 days. You can use this to gain an idea of whether or not people are currently (within the last 7 days) buying or selling this cryptocurrency.
Market Cap
Market capitalization here will show the total amount of money that is invested in a specific cryptocurrency or token. As mentioned, this is how coins are ranked on CoinMarketCap and this can give you an idea of how popular a specific cryptocurrency is.
Volume(24h)
You can use this to gain an idea of the trading activity of a particular coin. Just like looking at the volume of the entire cryptocurrency market can give an understanding of the entire market activity, this give the value cryptocurrency that has traded hands within the last 24 hours and can be used to determine if people are actively trading it or not.
Circulating Supply
This simply portrays the amount of units that are currently in supply for a specific cryptocurrency. Different cryptocurrency work in different ways which is why it is important to do more research about a coin that you are interested in. Some cryptocurrencies are deflationary such as burn tokens meaning that the circulating supply will decrease over time. The other type of deflationary tokens have a supply limits meaning that they should, in theory, become more valuable as time goes on as long as the demand stays the same. Some cryptocurrencies are considered inflationary and have no supply limit as new coins will continue to be minted into infinity. This is important to know in order to gain an idea of how valuable your cryptocurrency holdings could actually be in the future. If there is a large supply and an infinitely increasing supply at a quicker rate than the demand of the coin, then your coins may not be that valuable $ wise. However, if you are invested in the future of a cryptocurrency and never plan on selling, then this may not be such a big deal to you because you may hope that the tokens bring you more overall value than the fiat % gain. Disclaimer: it is highly important to look at each case individually.
Last 7 Days
This is a line graph that shows the price of the cryptocurrency within the last 7 days. If it is green (and going up), it shows that this currency has increased in value and more people have bought than sold over the last 7 days. Thus, the price should reflect an increase. If this is red (and going down), this shows that the cryptocurrency has lost value and more of this cryptocurrency has been bought than sold within the last 7 days. Therefore, the price should reflect a decrease.
Conclusion
CoinMarketCap is a great resource to gain more information about cryptocurrencies that are currently on the market. You can gain insight about cryptocurrencies that are already popular, but you can also gain more information about new cryptocurrencies that have yet to show their value to the cryptocurrency market. CoinMarketCap provides a lot more information than what is posted in this article; however, I believe that it is a great place to start when doing your own research on a cryptocurrency project. The importance of being able to do your own research cannot be stressed enough because although there are so many opportunities out there in the cryptocurrency world, there are also many scams lurking around. Please do your own due diligence when looking at cryptocurrencies and most importantly, do not invest more into cryptocurrency than you can afford to lose.


